API Metering and Analytics for Early Stage Startups
Who is using the HTTP APIs of your application? Which endpoints are called most? How much do you charge for API usage? How many errors were there last week? Where do the calls originate from? What share of calls comes from the management portal vs the CLI vs SDK? Which version?
These are some of the questions that matter a lot to product and engineering teams of any API-first platform. In this post, I will describe a simple to build and inexpensive to run metering solution for the HTTP APIs of your app that you can put in production in a day, using BigQuery and DataStudio.

To Meter Or Not To Matter
There is a class of applications for which HTTP APIs are the primary surface area. If you are running one, understanding the usage patterns of your APIs is key to understanding your customers, informing product and engineering decisions, and sometimes billing.
There are many tools for metering and analytics of web-based applications that are simple to set up and use. Google Analytics is one of them. However, few inexpensive, plug-and-play options exist for applications for which HTTP APIs are the primary surface area.
In this post, I describe a simple HTTP API metering solution. It takes a day to set up, costs a pittance to run, requires zero maintenance, and offers a lot of flexibility. It is particularly well suited in the early days of an application, where engineering time is a precious commodity and you need a future-proof solution with the flexibility to get answers to questions that may not yet have been asked.
Choosing the Right Technologies
There are two key components of an HTTP API metering and analytics solution: data collection and storage, and reporting. Choosing the right set of tools depends on what you are optimizing for. Here are some of the criteria that are often important for early-stage projects:
- The data collection and storage must be fully managed, automatically scalable, and inexpensive to operate. In the early days of a project, no one wants to spend engineering time babysitting software updates of a DB engine or capacity planning to adjust to changing needs.
- The data storage must allow for flexible ways of querying the data to gain insights. At the time a project is starting, it is often impossible to foresee the questions you will want to answer and the hypothesis to validate.
- The reporting layer must integrate well with the data layer and offer the flexibility to quickly create new reports and dashboards presenting whatever view of the information that is relevant at a given stage.
After some research, we zeroed in on BigQuery for the data collection, storage, and querying layer. It is fully managed, designed for data ingest and query workload, supports flexible SQL-based query language, and is very inexpensive compared to some of the alternatives.
For reporting, DataStudio was a natural choice as it is part of the Google ecosystem and integrates well with BigQuery. What we liked about DataStudio was the flexibility to create any report or dashboard we needed with little effort using any views of the data created in BigQuery using SQL. Also, the fact it was free played a role in the early days - there are many reporting alternatives out there that cost an arm and a leg. The one disadvantage of the platform we decided to live with was limited integration capabilities. For example, while a report can be sent by e-mail, it cannot be easily sent to Slack.
While AWS has reasonable alternatives, Google’s BigQuery and DataStudio combo provides considerable advantages to offset the added complexity of multi-cloud.
Building An API Metering Solution
Here is the basic architecture of the simple end-to-end metering and analytics solution we’ve built with BigQuery and Data Studio:

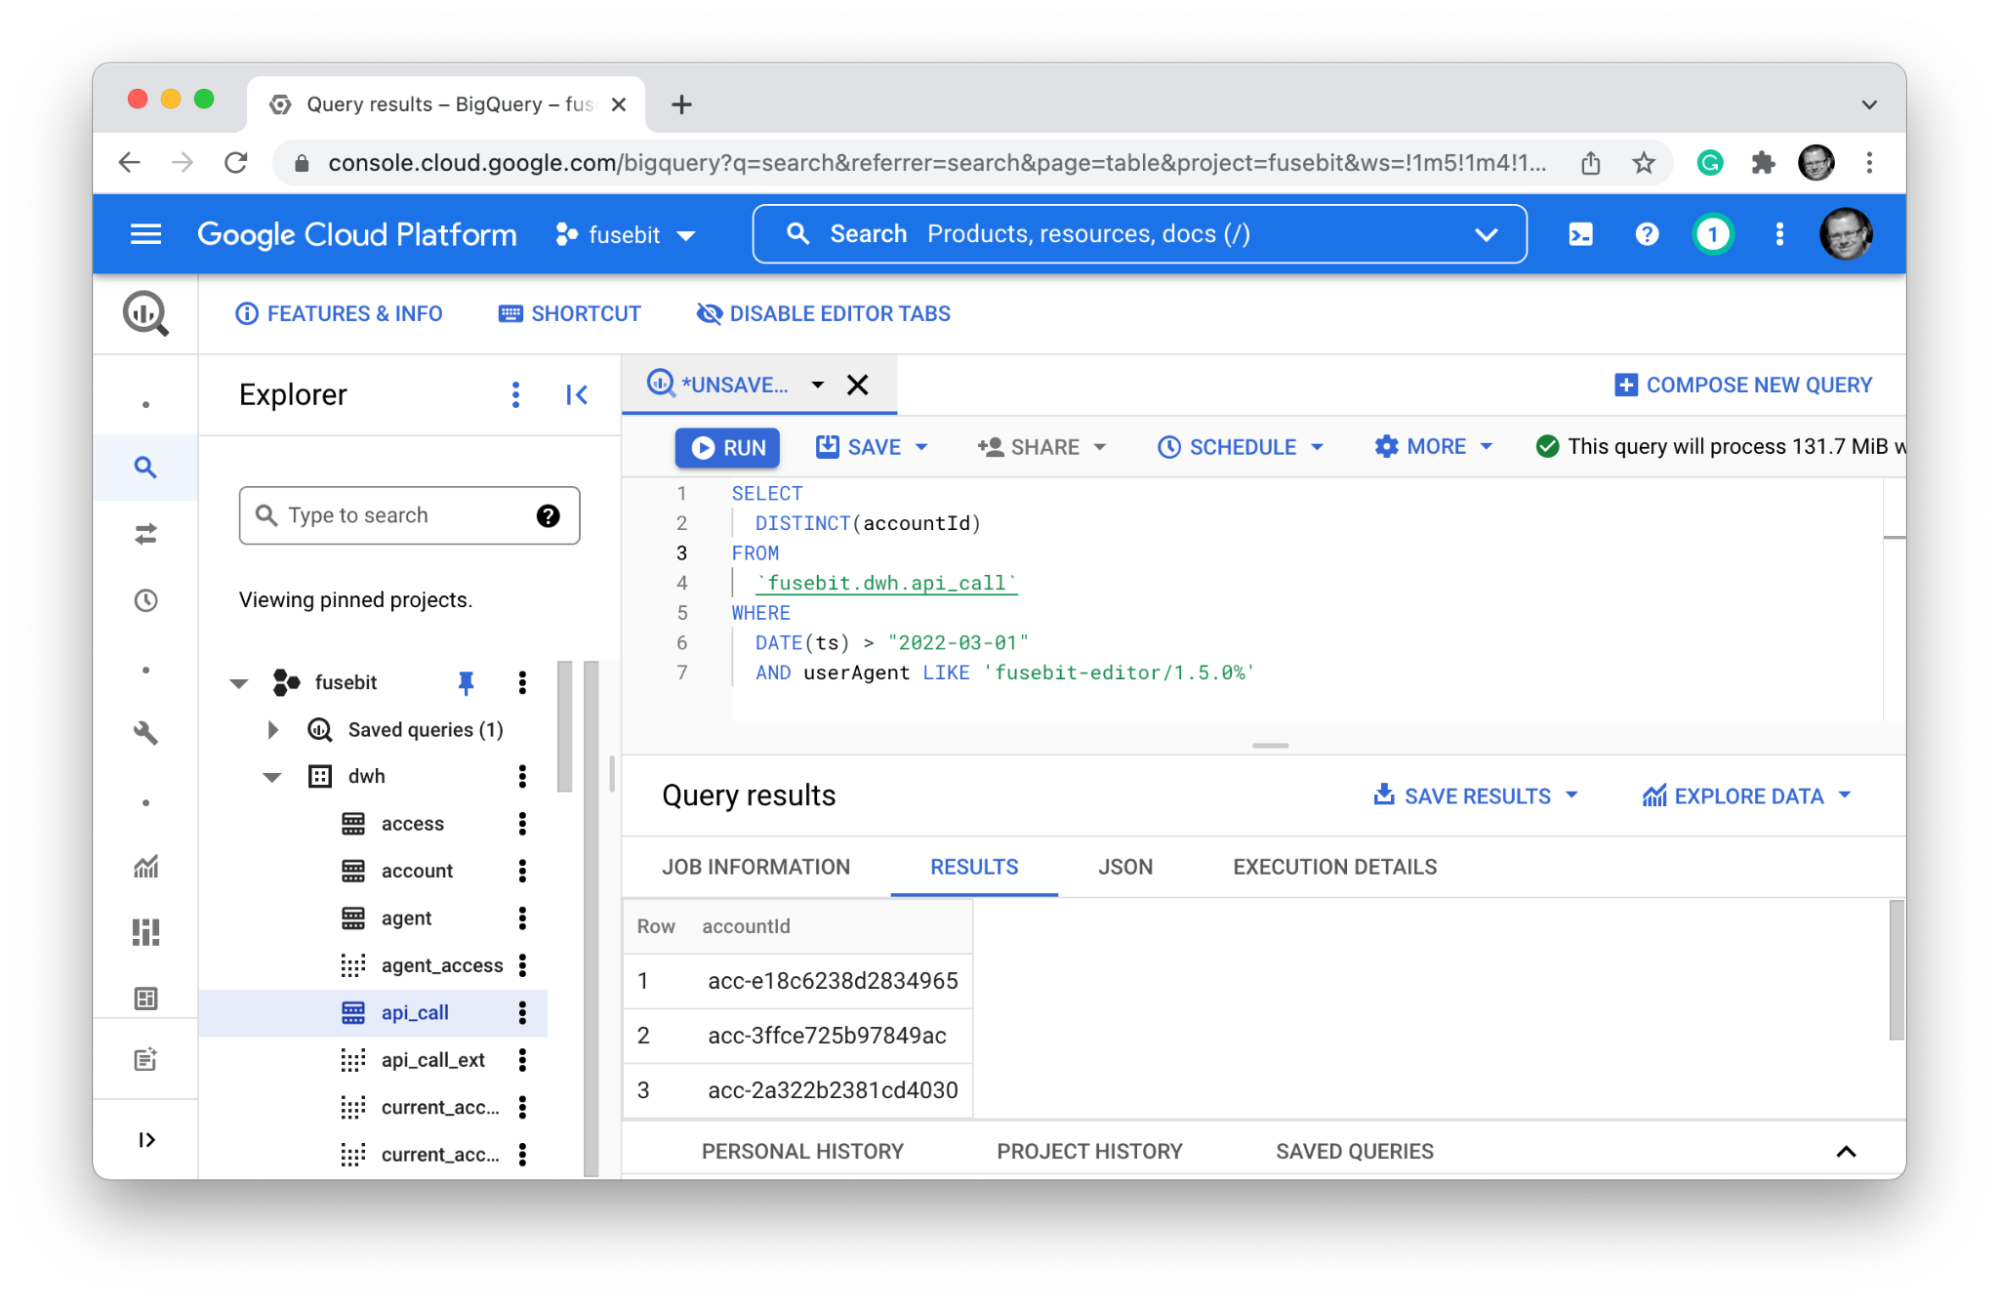
The application records metering data in BigQuery when it receives HTTP requests, one record per HTTP request. To reduce the request frequency to BigQuery, metering data is uploaded in batches as soon as X records have accumulated in memory or the Y milliseconds elapsed since the last upload. Once the data is in BigQuery (recorded in “real-time” from the perspective of the reporting requirements), it becomes available to all DataStudio reports as well as any ad-hoc SQL queries issued from Google Cloud Console. The latter is particularly useful in maintaining flexibility to answer questions that have not yet been formulated at the time this system was put in place.
What data about an HTTP API request is worth recording? The nice thing about BigQuery is that you don’t need to know upfront as you can always expand the schema later. It is nice to have this option in the early days of your app when your metering and analytics requirements are not yet stable. Here is a set of attributes we started with:
- The timestamp of the request. This is key to analyzing the data through time and creating histograms.
- The resource being accessed. This roughly correlates to the URL path if your HTTP API is REST-based, but you can also normalize the resource representation using application-level concepts, assuming they are defined well enough at that point.
- The action to be performed on this resource. This usually corresponds to the HTTP verb of the request (GET, PUT, POST, etc.), but may also be finer-grained depending on your API model.
- The caller identity information. This assumes you are only interested in recording authenticated calls and depends on how you authenticate callers.
- The user agent of the request. We found it useful to help us understand what software was used to issue the request.
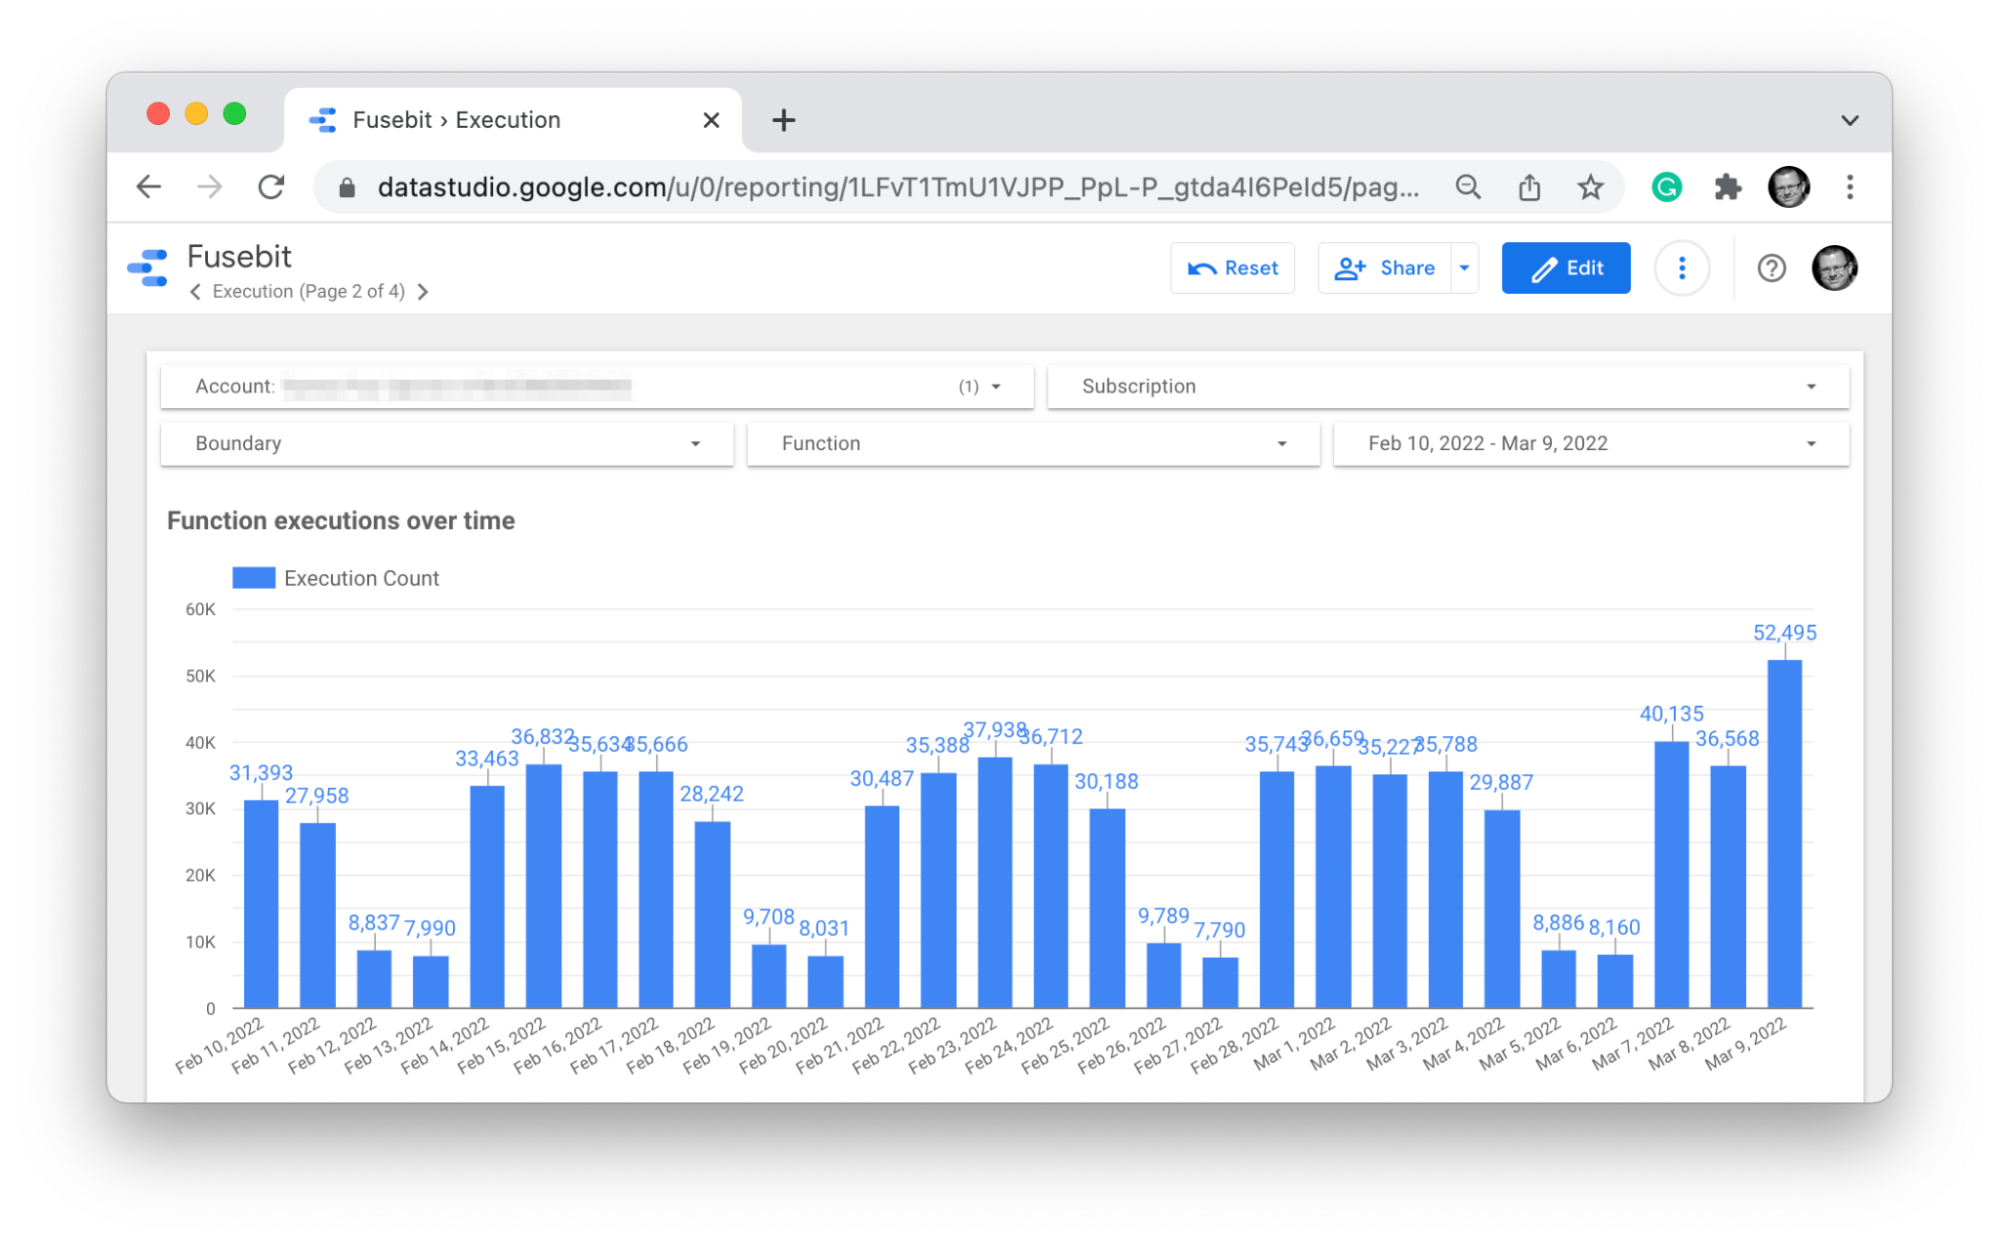
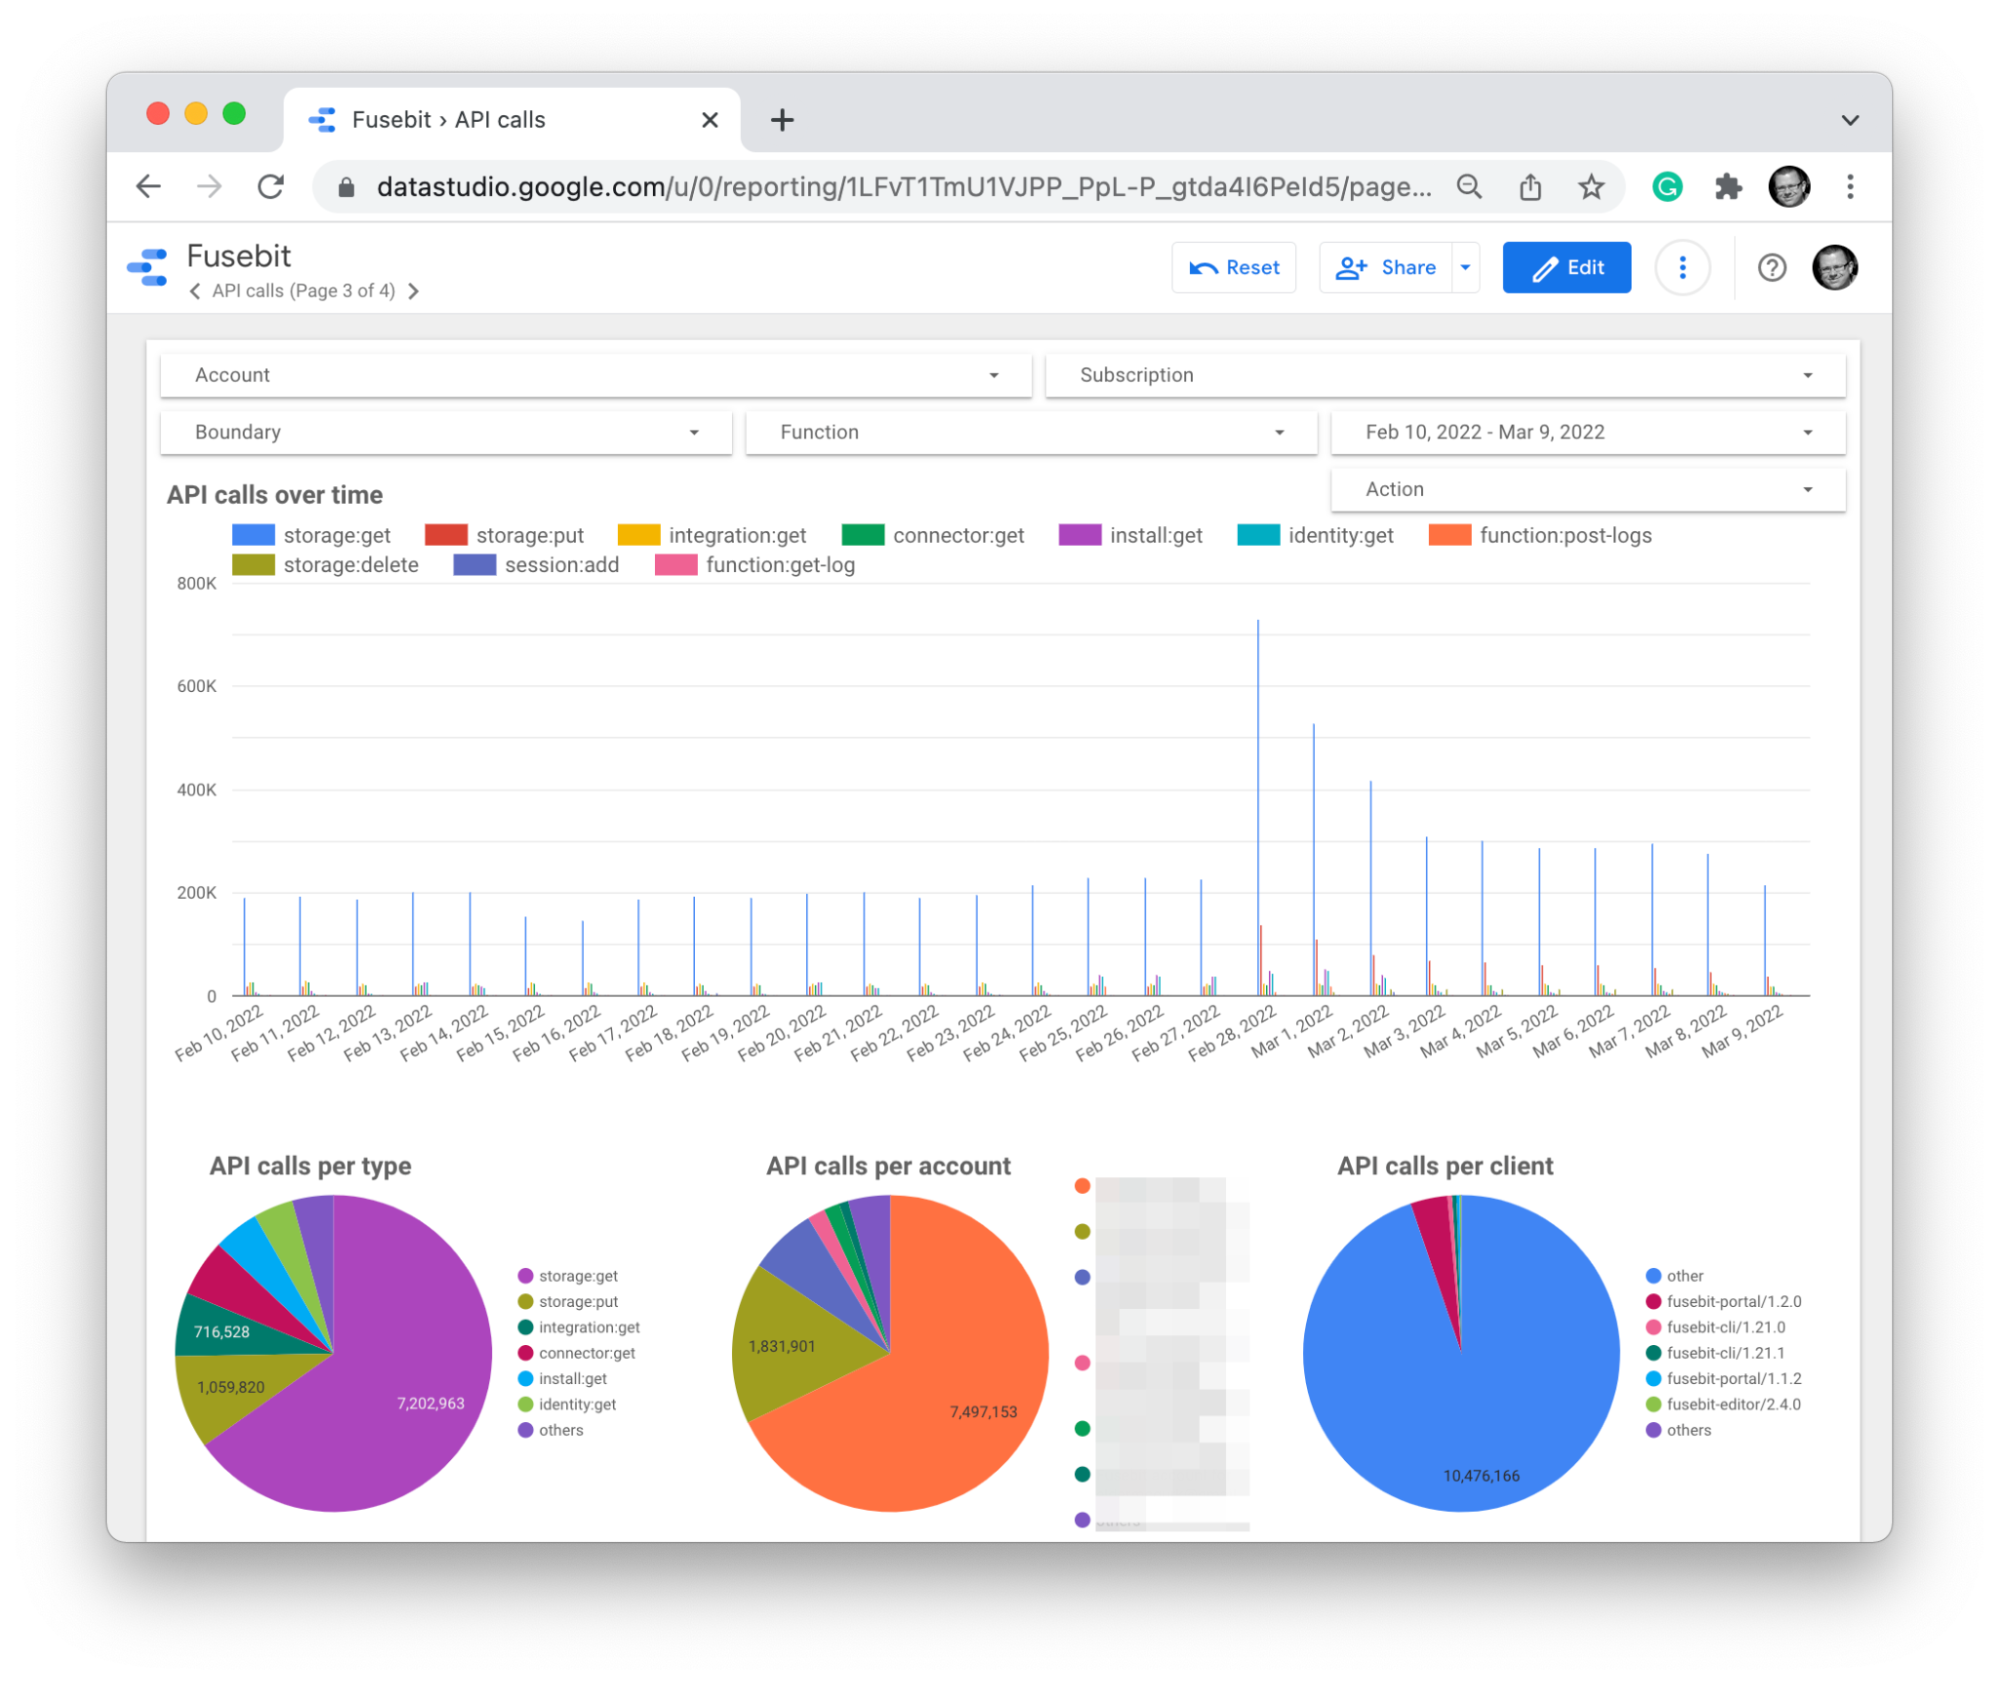
Having collected just this small set of information per request allows you to quickly get answers to many ad-hoc questions you will face using Google Cloud Console to run arbitrary SQL queries directly against BigQuery. You can also encode answers to the recurring questions using DataStudio reports and dashboards.

Some insights possible to derive from the metering data:
- Is the customer engagement with the product increasing? Which customers are driving it?
- What APIs are being used most, which parts of the system must scale?
- Is product usage cyclical, are there spikes of usage?
- How quickly are customers migrating to the new version of our CLI? Which customers are lagging behind?
- Are there any abuses of the system indicating malicious action or a bug in the customer’s code?

Over time, we enhanced the scope of our metering data to derive even more insights. Response status codes, latency, etc.
Maintenance And Cost
And now comes the best part of this simple metering solution.
BigQuery requires virtually zero maintenance in our experience.
The only ongoing engineering effort we had to make after the initial implementation was related to adding new reports and dashboards to DataStudio. These were investments that were justified with the immediate benefits of additional insights they provided as opposed to infrastructure taxes.
The second best part of the technology stack was the cost.
For months, our monthly Google Cloud bills were under $1.50.
The cost is of course a function of the load on your system, but BigQuery has a very favorable cost scalability characteristic for the metering workload compared to all alternatives we considered.
